Bitcoin Price Analysis (BTCUSD): Key Support and Resistance Levels to Watch
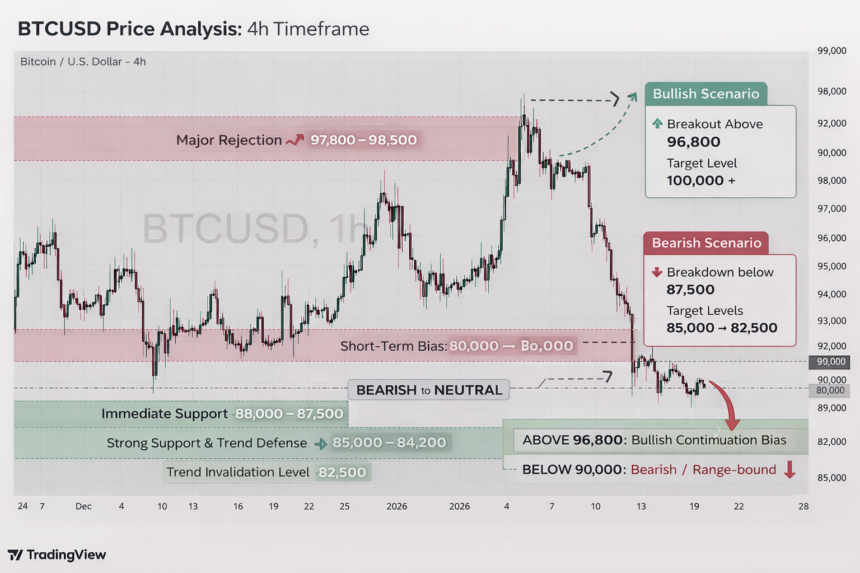
Bitcoin (BTCUSD) is currently trading under pressure as price action on the 4-hour timeframe shows signs of exhaustion following a strong bullish rally. After reaching highs near the 98,000 level, Bitcoin faced strong selling pressure, leading to a corrective move that has shifted short-term market sentiment.
- Bitcoin Price Analysis (BTCUSD): Key Support and Resistance Levels to Watch
- BTCUSD Market Structure Breakdown
- Bitcoin Trend Analysis: Bullish or Bearish?
- Key Resistance Levels in BTCUSD
- Important Support Zones to Watch
- BTCUSD Price Action Insights
- Trading Scenarios for Bitcoin (BTCUSD)
- Risk Management Advice
- Final Thoughts on Bitcoin Price Forecast
This technical analysis focuses on price structure, trend strength, and key levels that traders should closely monitor in the coming sessions.
BTCUSD Market Structure Breakdown
The BTCUSD 4-hour chart reveals a classic post-rally correction. After forming a strong impulsive move to the upside, price failed to sustain above the 97,000–98,000 resistance zone. This rejection resulted in a series of lower highs, signaling weakening bullish momentum.
While the broader trend remains bullish on higher timeframes, the current structure suggests a short-term bearish or sideways phase.
Bitcoin Trend Analysis: Bullish or Bearish?
From a trend perspective:
- Long-term trend: Bullish
- Medium-term trend: Neutral
- Short-term trend: Bearish
Bitcoin is trading below key moving price zones, indicating that buyers are currently cautious. The inability to reclaim previous highs suggests that the market is waiting for fresh demand or a liquidity sweep.
Key Resistance Levels in BTCUSD
Resistance zones play a crucial role in determining future price direction:
🔴 97,800 – 98,500
This zone represents the recent swing high where heavy selling occurred. A breakout above this level would invalidate the current bearish structure and signal trend continuation.
🔴 95,500 – 96,800
This area has acted as both support and resistance in the past. Price rejection from this zone confirms it as a strong supply region.
Important Support Zones to Watch
🟢 88,000 – 87,500
This is the nearest demand zone where buyers are attempting to defend price. A sustained hold above this level could lead to a relief bounce.
🟢 85,000 – 84,200
This is a major structural support. A breakdown below this zone could trigger deeper corrections.
🟢 82,500 (Trend Invalidation)
If Bitcoin drops below this level, the broader bullish trend would be at risk.
BTCUSD Price Action Insights
- Long bearish candles show strong seller dominance
- Weak bullish candles indicate lack of buying conviction
- Consolidation near support suggests possible accumulation or breakdown
Price behavior near the 88,000 zone will be critical in determining the next major move.
Trading Scenarios for Bitcoin (BTCUSD)
📈 Bullish Scenario
- Price holds above 88,000
- Breakout above 96,800
- Target zones: 100,000 and above
📉 Bearish Scenario
- Breakdown below 87,500
- Increased selling volume
- Target zones: 85,000 → 82,500
Risk Management Advice
- Avoid overleveraging during consolidation
- Wait for confirmation near key levels
- Use stop-loss below invalidation zones
Final Thoughts on Bitcoin Price Forecast
Bitcoin remains in a broader bullish structure, but short-term weakness suggests patience is required. Traders should closely monitor support and resistance levels, as price reaction at these zones will determine whether BTCUSD resumes its uptrend or enters a deeper correction.