Solana (SOL) has been one of the most actively traded cryptocurrencies, known for its high-speed blockchain, low transaction costs, and strong developer ecosystem. However, price action over the past year shows that market structure matters more than hype.
In this detailed technical analysis, we’ll break down:
- Solana’s daily chart trend
- Major support and resistance zones
- Market structure (higher highs vs lower lows)
- Probable price scenarios for 2026
- Investor & trader sentiment
This article is SEO-optimized, beginner-friendly, and suitable for long-term investors and swing traders.
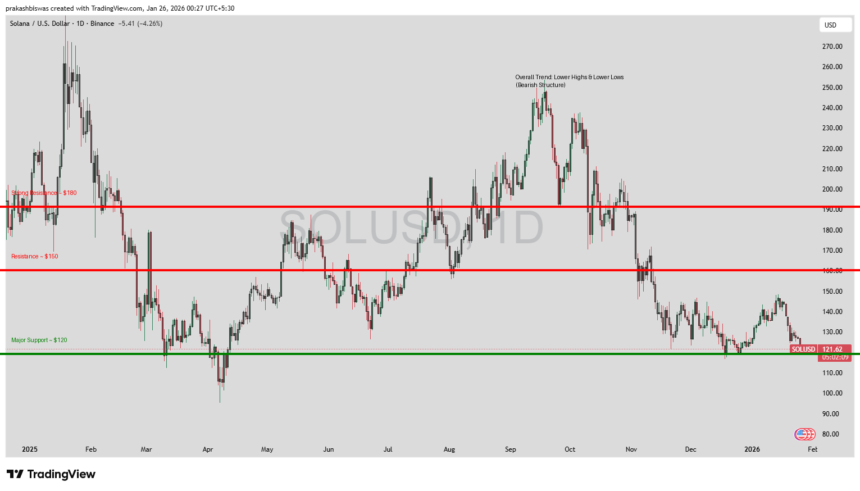
Solana Daily Chart Overview (SOL/USD)
- Timeframe: 1D (Daily)
- Exchange: Binance
- Current Price Area: ~$121
- Market Phase: Bearish to Accumulation
From early 2025 to early 2026, Solana experienced high volatility, moving from aggressive rallies to deep corrections.
Market Structure Analysis
1. Clear Lower Highs & Lower Lows
The chart clearly shows:
- A major top near $250
- Followed by lower highs around $230 and $200
- Continuous breakdowns toward $150 → $130 → $120
This confirms a bearish market structure, where sellers dominate rallies.
🔍 In technical analysis, lower highs + lower lows = downtrend
Key Support Levels for Solana
🟢 Major Support Zone: $120 – $115
- Price has reacted multiple times near this area
- Buyers are defending this level aggressively
- This zone is acting as a demand and accumulation area
If $120 holds, we may see:
- Sideways consolidation
- Short-term relief rally
If $120 breaks, next downside targets:
- $105
- $95
- $80 (historical demand zone)
Key Resistance Levels for Solana
🔴 Immediate Resistance: $150
- Strong rejection zone
- Price failed multiple times to sustain above this level
🔴 Major Resistance: $180
- Previous breakdown level
- Strong supply zone
- Bulls must reclaim this level to change trend
🔴 Macro Resistance: $200 – $220
Trend reversal only possible above this zone
Trend Strength & Momentum
Bearish Bias Still Active
No strong bullish engulfing structure
Rallies are weak and corrective
-
Volume does not support strong upside
Accumulation Signals (Early)
- Long wicks near $120
- Reduced selling pressure
- Sideways movement after heavy sell-off
This suggests smart money accumulation, not trend reversal yet.
Solana Price Scenarios for 2026
📉 Bearish Scenario (Probability: Medium)
- Breakdown below $120
- Targets: $105 → $95 → $80
- Triggered by overall crypto market weakness
🔄 Sideways Accumulation (Probability: High)
- Range between $115 – $150
- Best phase for long-term investors
- Builds base for next cycle
🚀 Bullish Reversal (Probability: Low–Medium)
- Daily close above $180
- Higher high formation
- Strong volume confirmation
- Targets: $220 → $250
Investor & Trader Strategy
Long-Term Investors
Ideal DCA zone: $120 – $100
Avoid chasing breakouts
Focus on accumulation, not quick gains
Swing Traders
Buy near support ($120)
Sell near resistance ($145–$150)
Strict stop-loss below $115
Short-Term Traders
Trade only confirmed breakouts
Avoid overleveraging in sideways markets
Fundamental Strength of Solana
Despite price weakness, Solana remains strong fundamentally:
- High TPS blockchain
- Growing DeFi & NFT ecosystem
- Strong developer adoption
- Institutional interest returning slowly
📌 Price may lag fundamentals — but fundamentals often lead the next rally.
Conclusion
Solana is currently in a critical accumulation phase after a prolonged downtrend. While the broader trend remains bearish, $120 is a decisive level that could define Solana’s next major move.
For now:
- 📉 Trend = Bearish
- 🟢 Opportunity = Accumulation
- 🚀 Confirmation = Above $180
Patience is key. Smart money buys fear — not hype.