Litecoin Price Analysis: LTCUSD Under Strong Selling Pressure
Litecoin (LTCUSD) is currently experiencing sustained selling pressure, as seen on the 4-hour timeframe. After failing to hold above key resistance levels, Litecoin entered a strong bearish phase, pushing price toward critical support zones.
- Litecoin Price Analysis: LTCUSD Under Strong Selling Pressure
- LTCUSD Market Structure Breakdown
- Litecoin Trend Analysis: Bullish or Bearish?
- Key Resistance Levels in Litecoin (LTCUSD)
- Important Support Zones to Watch
- Litecoin Price Action Insights
- Litecoin Trading Scenarios
- Risk Management Tips for Litecoin Traders
- Final Thoughts on Litecoin Price Forecast
This Litecoin technical analysis provides a detailed breakdown of the current market structure, trend direction, and key price levels traders should monitor.
LTCUSD Market Structure Breakdown
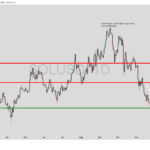
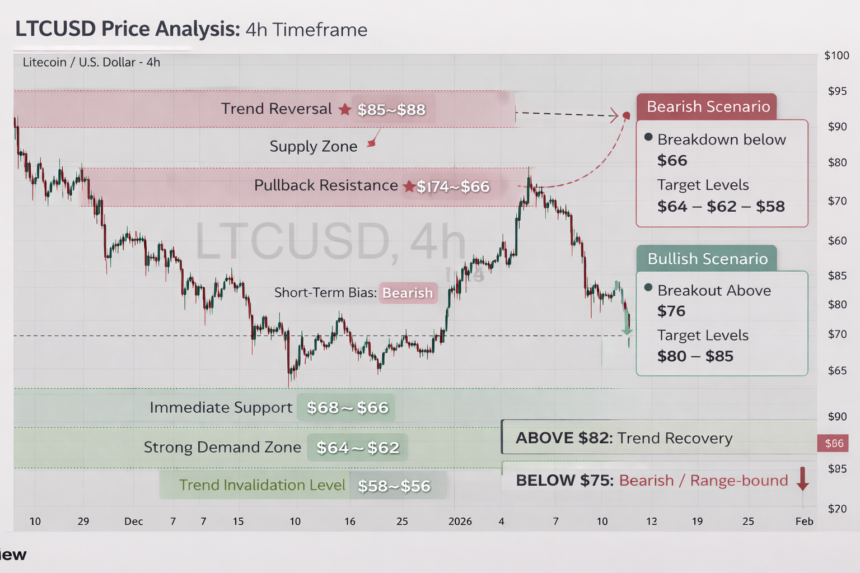
The LTCUSD 4-hour chart reveals a well-defined bearish structure. Price action shows a sequence of lower highs followed by aggressive breakdowns, confirming seller dominance.
The failure near the $85–$88 resistance zone marked the beginning of a strong downside move. Since then, Litecoin has struggled to attract meaningful buying interest, leading to continued weakness.
Litecoin Trend Analysis: Bullish or Bearish?
- Long-term trend: Neutral
- Medium-term trend: Bearish
- Short-term trend: Bearish
Litecoin is currently trading below all major structure levels, indicating that the market remains under bearish control.
Key Resistance Levels in Litecoin (LTCUSD)
🔴 $85 – $88 (Major Resistance)
This zone represents the previous distribution area where strong selling emerged. A breakout above this level would signal a major trend shift.
🔴 $80 – $82 (Supply Zone)
Price failed multiple times in this region, confirming strong seller presence.
🔴 $74 – $76 (Pullback Resistance)
This is the nearest resistance level where sellers may re-enter on a bounce.
Important Support Zones to Watch
🟢 $68 – $66 (Immediate Support)
Litecoin is currently trading near this zone. A temporary bounce is possible, but confirmation is required.
🟢 $64 – $62 (Strong Demand Zone)
This is a historically important level where buyers previously defended price.
🟢 $58 – $56 (Trend Invalidation)
A breakdown below this zone could trigger panic selling and extended downside.
Litecoin Price Action Insights
- Strong bearish candles indicate institutional selling
- Weak bullish candles suggest low buyer confidence
- Sideways movement near support may indicate short-term accumulation or continuation lower
Litecoin Trading Scenarios
📉 Bearish Scenario
- Price stays below $75
- Breakdown below $66
- Targets: $64 → $62 → $58
📈 Bullish Scenario
- Hold above $66
- Break above $76
- Targets: $80 → $85
Risk Management Tips for Litecoin Traders
- Avoid aggressive longs during downtrend
- Wait for structure confirmation
- Use stop-loss below key invalidation levels
Final Thoughts on Litecoin Price Forecast
Litecoin remains technically weak on the 4-hour timeframe. While short-term bounces are possible near support, the overall trend favors sellers unless price reclaims key resistance levels. Traders should remain patient and trade with confirmation rather than prediction.