Introduction
Gold (XAUUSD) has always been one of the most traded and trusted financial instruments in the global market. Traders and investors closely monitor gold prices due to its role as a safe-haven asset, hedge against inflation, and store of value.
- Introduction
- 📊 XAUUSD Daily Timeframe Overview
- 🔼 Bullish Trend Structure Explained
- 🟨 Support and Resistance Zones (SRZ)
- 🔁 Breakout and Retest Behavior
- 📐 Trendlines & Market Geometry
- 📈 Momentum & Price Action Signals
- 🧠 Market Psychology Behind the Move
- ⚠️ Risk & Correction Expectations
- 📌 Summary of XAUUSD Technical Outlook
In this article, we will provide a detailed technical analysis of the XAUUSD daily chart, focusing on trend structure, support and resistance zones, and price behavior. This analysis is based purely on technical price action, making it useful for traders, analysts, and market learners.
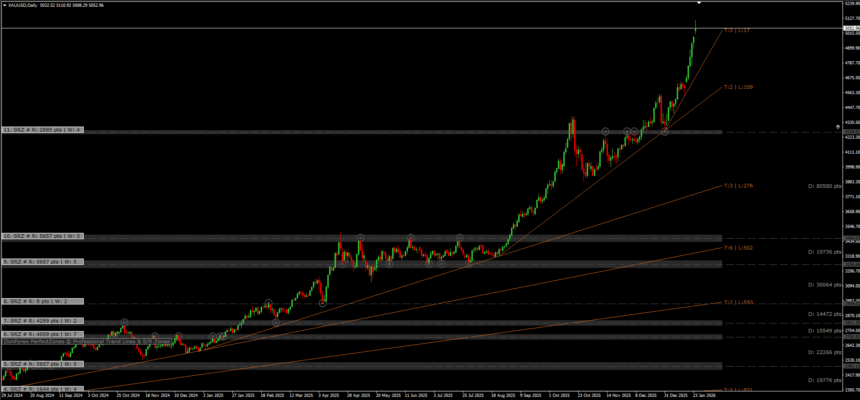
📊 XAUUSD Daily Timeframe Overview
The daily chart of XAUUSD clearly shows a strong bullish trend that has been developing over an extended period. Price action has consistently formed higher highs and higher lows, confirming long-term buyer dominance.
The market has respected multiple ascending trendlines, indicating that gold is moving within a structured upward channel rather than random volatility.
🔼 Bullish Trend Structure Explained
One of the strongest signs on this chart is the clean trend structure:
- Higher swing highs
- Higher swing lows
- Price holding above trendline support
- Strong impulsive bullish candles
Each pullback has been met with renewed buying pressure, suggesting that buyers are aggressively defending key price zones.
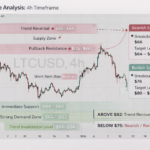
🟨 Support and Resistance Zones (SRZ)
The chart highlights several major SRZ areas, which play a critical role in price movement.
Key Support Zones
- Former resistance areas now acting as support
- Accumulation zones where price consolidated before breaking out
- Trendline confluence zones
These areas historically attracted buyers, making them important zones to watch during pullbacks.
Key Resistance Zones
- Previous highs
- Psychological round-number levels
- Upper trendline extensions
Once price breaks and closes above resistance on the daily timeframe, it often leads to strong continuation moves, as seen on this chart.
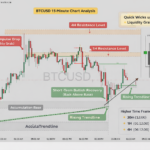
🔁 Breakout and Retest Behavior
A major technical highlight is the breakout from a long consolidation range. After moving sideways for an extended period, gold broke above resistance with strong bullish candles.
Following the breakout:
- Price retested the broken zone
- Buyers stepped in aggressively
- Market continued higher
This breakout–retest–continuation pattern is a classic bullish market behavior and often signals trend sustainability.
📐 Trendlines & Market Geometry
Multiple ascending trendlines are drawn on the chart, showing:
- Long-term trend support
- Intermediate pullback zones
- Steeper short-term momentum lines
As price moves higher, it shifts from one trendline to another, reflecting increasing momentum rather than weakness.
A break below the steep trendline does not necessarily mean a trend reversal — it may simply indicate a healthy correction toward a stronger base trendline.
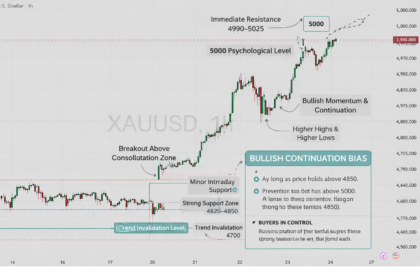
📈 Momentum & Price Action Signals
The recent price action shows:
- Large bullish candles
- Small bearish pullbacks
- Strong closes near daily highs
This type of behavior usually appears when:
- Buyers are in control
- Sellers fail to push price lower
- Market sentiment remains bullish
As long as price continues to hold above key daily support zones, the bullish bias remains intact.
🧠 Market Psychology Behind the Move
Gold often rallies when:
- Market uncertainty increases
- Inflation expectations rise
- USD weakens
- Investors seek safety
Technically, this chart reflects confidence and accumulation, suggesting that large players are comfortable holding higher prices.
⚠️ Risk & Correction Expectations
Even in strong bullish trends:
- Corrections are normal
- Pullbacks help reset momentum
- Liquidity gets rebuilt
A retracement toward previous resistance-turned-support zones or trendlines would still be considered healthy price behavior, not weakness.
📌 Summary of XAUUSD Technical Outlook
| Aspect | Bias |
|---|---|
| Overall Trend | Bullish |
| Market Structure | Higher Highs & Higher Lows |
| Support Zones | Strong |
| Resistance | Being broken |
| Momentum | Strong |
| Pullbacks | Shallow & controlled |