Introduction
Bitcoin (BTCUSD) remains the most actively traded cryptocurrency in the world. Traders across the globe closely monitor Bitcoin price movements to understand market sentiment, liquidity behavior, and trend direction. Technical analysis plays a crucial role in identifying potential opportunities by studying price action, structure, and key zones.
- Introduction
- 📈 BTCUSD 15-Minute Chart Overview
- 🔁 Market Structure Breakdown
- 📐 Rising Trendline & Bullish Recovery
- 🟨 Support & Resistance Zones
- ⏱ Multi-Timeframe Confluence
- 🔄 Liquidity Behavior & Wicks
- 📉 Recent Rejection & Pullback
- 🧠 Market Psychology
- 🔍 What This Chart Tells Us
- 📌 Technical Summary Table
- 📢 Final Thoughts
In this article, we provide a detailed BTCUSD technical analysis based on the 15-minute timeframe, focusing on market structure, support and resistance, trendlines, and price behavior. This analysis is educational and intended for market understanding.
📈 BTCUSD 15-Minute Chart Overview
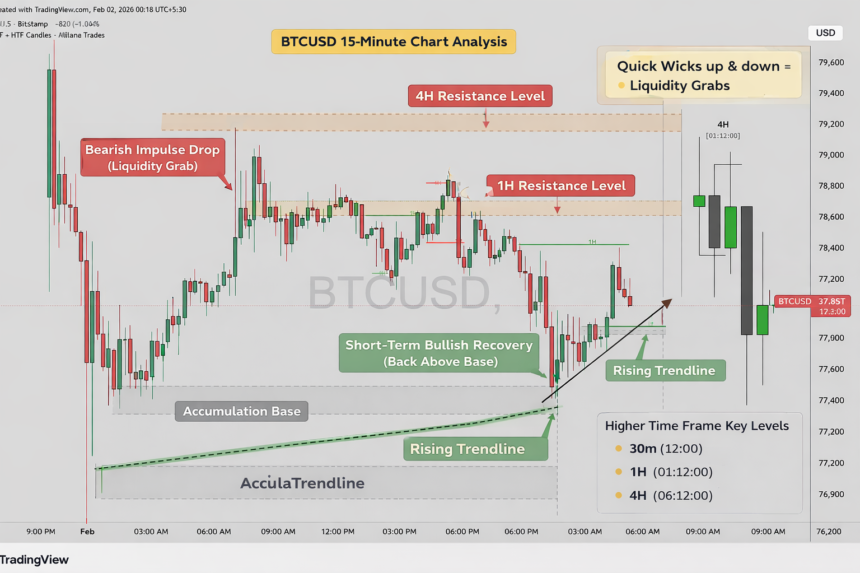
The chart shows BTCUSD on a 15-minute timeframe, sourced from Bitstamp via TradingView. Price is currently trading near the 77,800–78,000 zone, following a volatile intraday session.
Key characteristics visible on the chart:
-
High intraday volatility
-
Strong impulsive moves followed by consolidation
-
Clear structure shifts
-
Formation of a rising trendline
-
Reaction at higher-timeframe levels (1H, 4H)
🔁 Market Structure Breakdown
Bearish Impulse Phase
Bitcoin initially experienced a strong bearish move, marked by:
-
Large red candles
-
Sharp downside momentum
-
Liquidity sweep below previous lows
This move likely triggered stop-loss orders and forced liquidation, which is common during high-volatility sessions.
Accumulation & Base Formation
After the sharp decline, price entered a tight consolidation range, forming a base near the lows. This zone represents:
-
Reduced selling pressure
-
Buyers absorbing remaining supply
-
Market preparing for the next move
This type of structure often appears before a short-term trend reversal or corrective rally.
📐 Rising Trendline & Bullish Recovery
A clear ascending trendline can be seen forming after the base. This indicates:
-
Higher lows
-
Improving market sentiment
-
Buyers stepping in earlier on pullbacks
As long as price respects this rising trendline, the short-term bullish structure remains valid.
🟨 Support & Resistance Zones
Key Support Areas
-
The base consolidation zone near the trendline
-
Recent higher lows on the 15-minute timeframe
-
Lower wick rejections indicating buyer interest
These zones are important because they show where buyers are defending price.
Key Resistance Areas
-
Prior intraday highs
-
Marked 1H resistance level
-
Upper rejection wicks near 78,800–79,200
Price struggled to break above these zones, suggesting sell-side liquidity and profit-taking pressure.
⏱ Multi-Timeframe Confluence
The chart highlights higher-timeframe levels such as:
-
30-minute reaction zones
-
1-hour resistance
-
4-hour rejection candles
When price reacts strongly at higher-timeframe levels, it often leads to:
-
Temporary pullbacks
-
Range formation
-
Short-term trend pauses
This multi-timeframe confluence increases the importance of these levels.
🔄 Liquidity Behavior & Wicks
Long candle wicks on both sides indicate:
-
Aggressive stop-loss hunting
-
Liquidity grabs above highs and below lows
-
Indecision at higher price levels
These wicks suggest that large players are active, testing both sides of the market.
📉 Recent Rejection & Pullback
After a strong bullish push, BTCUSD faced rejection near the upper resistance zone. This resulted in:
-
Large bearish candles
-
A move back toward the mid-range
-
Price stabilizing near previous breakout levels
Such pullbacks are common after impulsive moves and help reset the market.
🧠 Market Psychology
This price behavior reflects:
-
Fear during the sell-off
-
Hope during the bounce
-
Uncertainty near resistance
Retail traders often chase breakouts, while experienced participants wait for confirmation or pullbacks.
🔍 What This Chart Tells Us
From a technical perspective:
-
The short-term structure shows attempted recovery
-
Resistance remains strong overhead
-
Buyers are active but cautious
-
Market is likely deciding between continuation or range
This environment favors patience and confirmation rather than aggressive entries.
📌 Technical Summary Table
| Element | Observation |
|---|---|
| Timeframe | 15 Minutes |
| Trend | Short-term recovery |
| Volatility | High |
| Structure | Base → Trendline → Pullback |
| Support | Rising trendline & base |
| Resistance | 1H & 4H levels |
| Bias | Neutral to mildly bullish |
📢 Final Thoughts
The BTCUSD 15-minute chart reflects a high-volatility market environment, where both buyers and sellers are actively competing. While a short-term recovery structure is visible, strong resistance overhead suggests caution.
This type of market often rewards:
-
Discipline
-
Patience
-
Waiting for confirmation
Understanding price action, trendlines, and liquidity behavior can help traders make better decisions and avoid emotional trading.