Ethereum Price Analysis Today: ETHUSD Under Selling Pressure
Ethereum (ETHUSD) is facing renewed selling pressure as price action on the 4-hour timeframe signals a clear shift in short-term market sentiment. After failing to sustain above the 3,300 resistance level, ETH has entered a corrective phase that traders should monitor closely.
- Ethereum Price Analysis Today: ETHUSD Under Selling Pressure
- ETHUSD Market Structure Breakdown
- Ethereum Trend Analysis: Bullish or Bearish?
- Key Resistance Levels in Ethereum (ETHUSD)
- Important Support Zones to Watch
- ETHUSD Price Action Insights
- Ethereum Trading Scenarios
- Risk Management Tips
- Final Thoughts on Ethereum Price Forecast
This Ethereum technical analysis focuses on trend structure, key support and resistance levels, and possible price scenarios for the near future.
ETHUSD Market Structure Breakdown
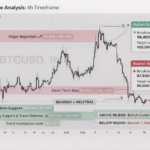
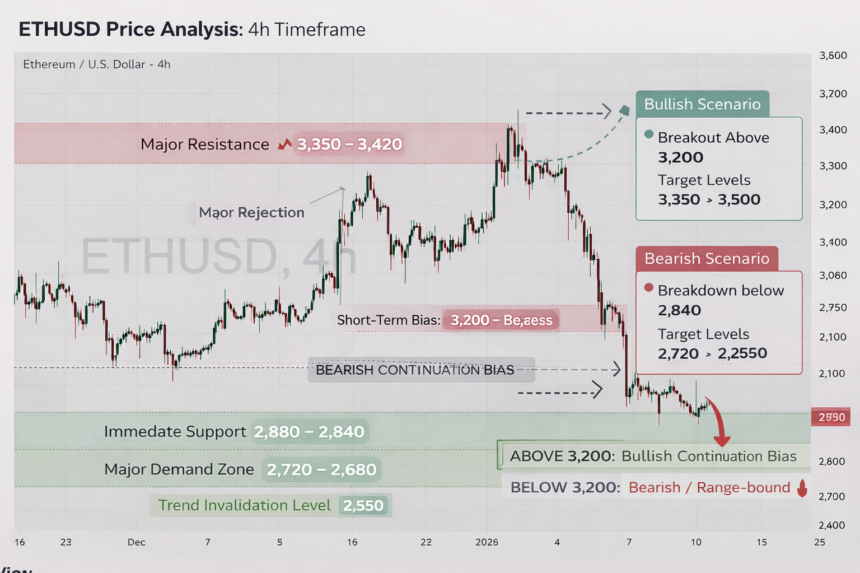
The ETHUSD 4H chart reveals a classic distribution pattern near the highs. Price formed a strong rally into the 3,350–3,400 region but failed to attract sustained buying interest. This resulted in a sharp rejection followed by a series of lower highs and lower lows.
Such price behavior typically indicates that smart money participants are offloading positions, leading to increased downside volatility.
Ethereum Trend Analysis: Bullish or Bearish?
-
Long-term trend: Bullish
-
Medium-term trend: Neutral
-
Short-term trend: Bearish
While Ethereum remains bullish on higher timeframes, the current correction suggests that price may continue to test lower demand zones before any meaningful recovery.
Key Resistance Levels in Ethereum (ETHUSD)
🔴 3,350 – 3,420 (Major Resistance)
This zone marks the recent swing high and strong selling pressure area. A breakout above this level would invalidate the current bearish structure.
🔴 3,200 – 3,280 (Pullback Resistance)
Price may revisit this zone during a relief bounce, but rejection here could resume the downtrend.
Important Support Zones to Watch
🟢 2,880 – 2,840 (Immediate Support)
ETH is currently testing this level. A bounce is possible, but strong confirmation is needed.
🟢 2,720 – 2,680 (Major Demand Zone)
This is a critical support area where buyers may step in aggressively.
🟢 2,550 (Trend Invalidation Level)
A breakdown below this level would significantly weaken Ethereum’s broader bullish outlook.
ETHUSD Price Action Insights
- Large bearish candles show strong seller dominance
- Weak bullish attempts indicate low buying conviction
- Consolidation near support suggests either accumulation or continuation lower
Price reaction around the 2,840 level will determine the next directional move.
Ethereum Trading Scenarios
📈 Bullish Scenario
- Hold above 2,840
- Break above 3,200
- Target levels: 3,350 → 3,500
📉 Bearish Scenario
- Breakdown below 2,840
- Increased selling volume
- Target levels: 2,720 → 2,550
Risk Management Tips
- Avoid trading without confirmation near support
- Use proper stop-loss below invalidation zones
- Do not over-leverage during high volatility
Final Thoughts on Ethereum Price Forecast
Ethereum is currently in a corrective phase within a larger bullish structure. Traders should remain cautious and focus on key support and resistance levels before making trading decisions. Patience and confirmation are crucial during such market conditions.