Gold (XAUUSD) continues to demonstrate impressive bullish strength as price action on the 1-hour timeframe confirms a well-established uptrend. Buyers remain firmly in control, pushing prices toward key psychological resistance levels.
XAUUSD Technical Overview – Gold Price Analysis
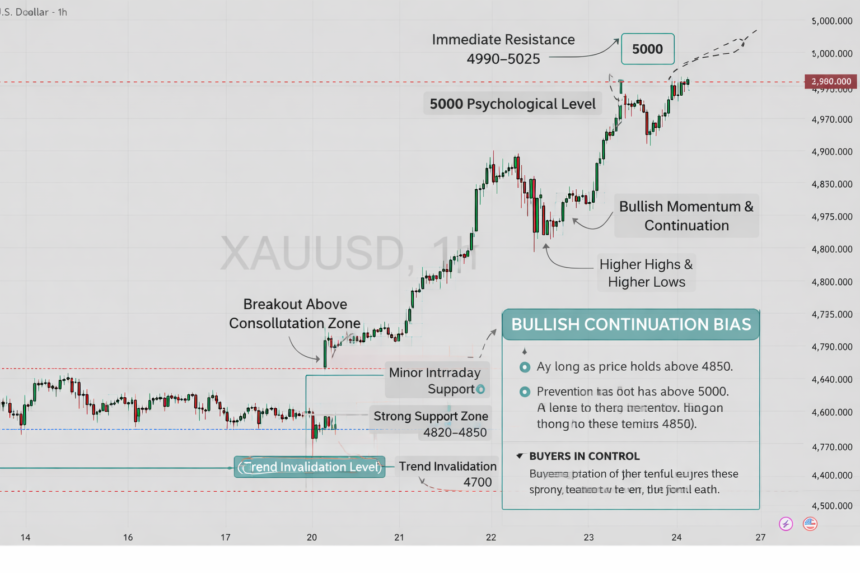
The recent price movement shows a clear shift from consolidation into a powerful bullish breakout. After trading sideways near the 4600–4700 zone, gold surged higher, forming a series of higher highs and higher lows — a classic sign of trend continuation.
Strong bullish candles with minimal pullbacks suggest sustained buying pressure and strong market confidence.
Key Support and Resistance Levels
Understanding critical price zones is essential for traders:
- Immediate Resistance: 4990–5025
- Major Psychological Level: 5000
- Intraday Support: 4900
- Strong Support Zone: 4820–4850
As long as gold remains above the 4850 support area, the bullish bias stays intact.
Market Sentiment and Trend Strength
Momentum indicators (price structure and candle behavior) reflect strong bullish sentiment. Sellers have failed to push price significantly lower, indicating that dips are being aggressively bought. This behavior often precedes continuation moves rather than reversals.
A sustained breakout above the 5000 level could open the door for further upside momentum in the near term.
Trading Outlook for Gold (XAUUSD)
- Bullish Scenario:
Holding above 4850 with a breakout above 5000 may lead to continued upside expansion. - Bearish Scenario:
A breakdown below 4700 would weaken the bullish structure and signal a possible trend shift.
Final Thoughts – Gold Price Analysis
Gold remains technically strong on the 1-hour timeframe, supported by solid bullish structure and strong demand at key levels. Traders should watch price behavior near the 5000 resistance zone, as a confirmed breakout could provide new trading opportunities.